
Software Programming
My First Slashdot Effect
Thanks to the Postgres Weekly issue #89 and a post to Hacker News front page (see Pgloader: A High-speed PostgreSQL Swiss Army Knife, Written in Lisp it well seems that I …
23 posts
Thanks to the Postgres Weekly issue #89 and a post to Hacker News front page (see Pgloader: A High-speed PostgreSQL Swiss Army Knife, Written in Lisp it well seems that I …

PostgreSQL comes with an awesome bulk copy protocol and tooling best known as the COPY and \copy commands. Being a transactional system, PostgreSQL COPY implementation …
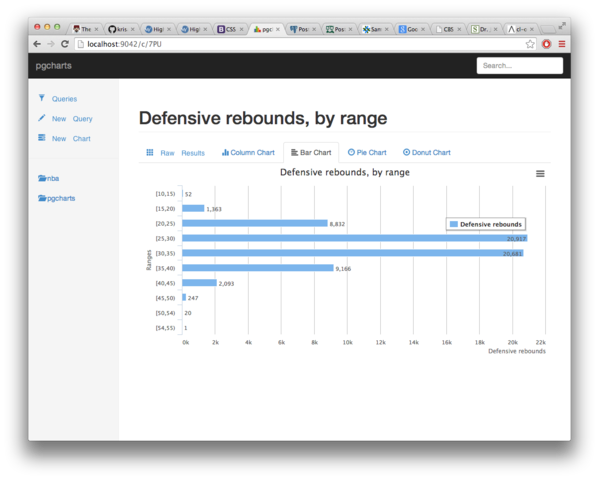
Earlier this year we did compare compare Aggregating NBA data, PostgreSQL vs MongoDB then talked about PostgreSQL, Aggregates and histograms where we even produced a nice …
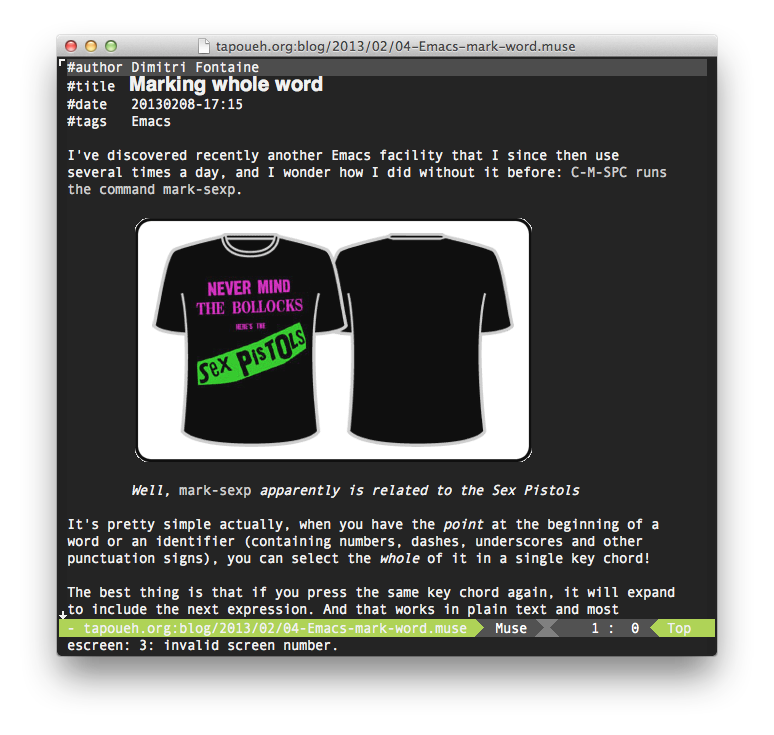
This blog of mine is written in the very good Emacs Muse format, that I find much more friendly to writing articles than both org-mode and markdown-mode that I both use …

Last week came with two bank holidays in a row, and I took the opportunity to design a command language for pgloader. While doing that, I unexpectedly stumbled accross a …

Thanks to Mickael on twitter I got to read an article about loosing scope with some common programming languages. As the blog article Lost in scope references functional …
I’ve been asked about how to integrate the ack tool (you know, the one that is better than grep) into Emacs today. Again. And I just realized that I didn’t …
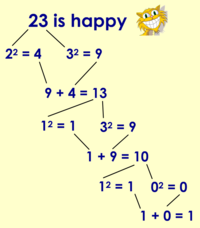
A while ago I stumbled upon Happy Numbers as explained in programming praxis, and offered an implementation of them in SQL and in Emacs Lisp. Yeah, I know. Why not, …
Thanks to Mickael on twitter I ran into that article about implementing a very basic Hello World! program as a way to get into a new concurrent language or facility. The …
I stumbled onto an interesting article about performance when using python, called Python performance the easy(ish) way, where the author tries to get the bet available …

Peter Norvig published a while ago a very nice article titled Solving Every Sudoku Puzzle wherein he presents a programmatic approach to solving that puzzle game. The …
A breadcrumb is a navigation aid. I just added one to this website, so that it gets easier to browse from any article to its local and parents indexes and back to …